How to use Google Analytics
Google have made it really easy to track the success of your website - you just need to know how.
What is Google Analytics?
This free to use software is the best way to measure the success of your website. If you aren't using it, you're missing out on a tool that can answer all of these questions:
- how many people visit my website?
- where did they come from?
- how effective is my advertising?
- which pages are the most popular?
- why are some web pages unpopular?
- which pages are making people leave my site?
- are there issues on mobile devices?
- which pages have a high bounce rate?
In short, if you want to make informed evidence based descisions about your business and your website, you need to be using Analytics.
How do I use it?
Quite easily. The interface is straight forward, and although there are a lot of options, you can quickly get a feel for it.
Every Iconography website comes with an Analytics integration provided. That means that all you'd need to do is to log into your account and start to see the stats!
At its simplest, Analytics is really simple.
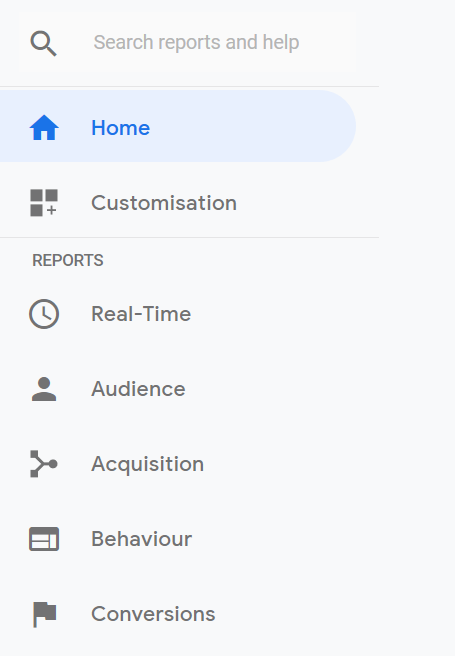
The menu is structured intuitively, so that you can quickly jump to the reports you need. Whether you want to learn who your audience is, discover how they found you, what they did on your site, or what they bought, Analytics can help.
A key part of Google Analytics is the ability to view data for a specific date range; once you set it, Analytics retains your dates as you jump between reports. This lets you easily view and compare site performance month on month, year on year, or around specific sale events.
One of the most commonly used features is the Behaviour section. Here you'll be able to find your most popular pages, along with other important information like Time on Page and Bounce Rate. Taken together, this information lets you pick out the problem pages on your site and allows you to form a strategy for improving your website.
With Analytics, any changes you make aren't simply a stab in the dark. You can spot issues, make changes and then track their effectiveness. Site management should be a constant cycle of research and improvement.
This applies to everything you do, but for an eCommerce website, Conversions are the real place to focus.
eCommerce Tracking
Beyond the basics, it's important to track specific data. Visitor numbers are great, but you need to catch conversions too. In Analytics, there are two ways of doing this - with eCommerce Tracking and Goals.
As standard, Zone1 websites will provide the following information (additional work can be completed under maintenance, as normal):
|
|
|
|
|
|
Analytics will provide you with a wide variety of information, but the behavioural information is possibly the most useful.
Reports on Shopping Behaviour and Checkout Behaviour provide crucial data when you try to improve the customer journey on your site. If you see a large drop off on a particular step of the checkout, make changes and watch to see their effect! Gradually, you can find your customers particular online needs and get rid of the speed bumps.
Elsewhere, you can track individual product performance, the effectiveness of internal promotions and overall revenue. Just remember that Google Analytics will not be 100% accurate; don't expect the data to cover every transaction or visit.
Limitations
Although Google Analytics is a powerful tool, it does have a few limitations. For example, while it can say that the bounce rate is high on a particular page, Analytics can't say why; there are other tools which can help with this, but you have to apply a bit of critical thinking.
However, there are more technical limitations. One of the most obvious is the data limit; Analytics will only record up to 10 million hits per month, or 200,000 hits per day. That's a pretty big limit, so won't affect most websites; missing data is likely to be lost for another reason.
Analytics can only record information that is being sent.
Unfortunately, ad blockers stop websites sending data. These are apps and browser add-ons which are designed to improve the online experience by removing unwanted pop-ups and advertising. In the UK, around 20% of web users have these installed, rising to 40% in the 18-24 demographic. With ad blockers on the rise, they have a real impact on the data being sent to Google Analytics.
Worse, the methods behind the integration can cause problems. At Iconography, we always insert on page code in the section, but other implementations are unreliable. In particular, it appears that the use of Google Tag Manager can harm tracking on some mobile devices.
If you're looking to use Google Analytics, you have to accept that it is representative; it is not an absolute measure.
The loss of up to 5% of hits and transactions is perfectly normal, and a 95% success rate is completely acceptable. Depending on the nature of your integration and target demographic, even a 10% loss rate might be reasonable!
Getting Set Up
If you haven't already set up a Google Analytics account, now is the time. All you need is a Google account and there is no charge, so there is no excuse. Just get in contact and we'll be happy to arrange the integration!
Iconography work closely with partner agencies who specialise in the Google software suite, including Analytics. If you're looking to make the most out of this fantastic program, we'll be happy to put you in touch.
25th March 2019